Our Equipment
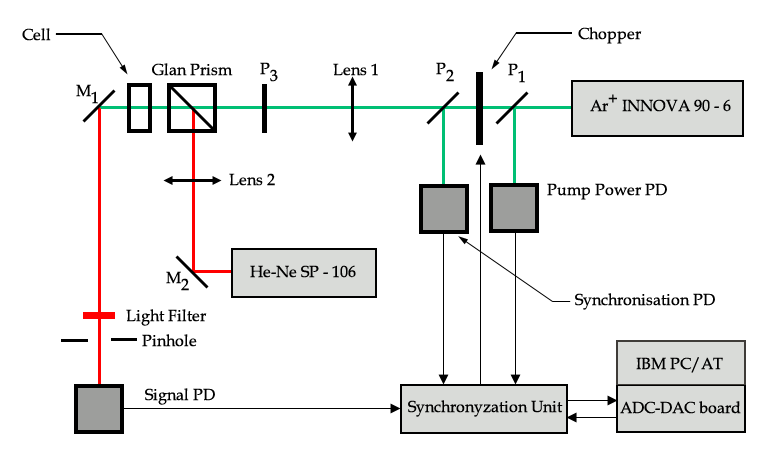
The thermal lens spectrometer was set up with parallel dual-beam optical configuration. The scheme of the spectrometer is shown below  An Ar+ laser (Innova 90-6, Coherent, Palo Alto, CA, USA; TEM00 mode, power range 10–600 mW) was used as a pump (excitation) beam; a He–Ne laser (SP-106-1, Spectra Physics, Eugene, OR, USA; TEM00 mode) was
exploited as a probe. The special mounts permitted to move both the lenses and the cell along the directions of laser beams. Photometry cell volume varied from 1 to 2 mL; optical path - 10 mm. A change in intensity in the centre of the probe beam was measured by a photodiode detector (Signal PD). The voltage from the signal photodiode (proportional to the power of registered light) was translated to an IBM PC/AT computer with a DT-2801A ADC–DAC board (Data Translation, Marlboro, MA, USA). A synchronisation block provided the pump power control (Pump Power PD) and synchronised action of the detectors and the chopper (Synchronisation PD). The data were gathered and handled under DMA control by self-made software. Lens 1 and Lens 2 are focusing lenses of the pump and probe lasers, respectively; P1 and P2 are glass plates; P3 is a glass plate for fine justification; M1 and M2 are mirrors; PD are photodiode detectors.
Optimisation of the optical-scheme design
The optimization of a TL spectrometer consists of the appropriate arrangement of the optical elements to improve the sensitivity, the precision, and the accuracy of measurement. In any analytical applications of TLS found in literature the only value indicating the quality of the constructed devices was the average limit of detection (or minimum detectable absorbance) for a model system. But there is a large set of applications where the limit of detection was low but linear dynamic range of the spectrometer proved to be too narrow (less than 1 order of magnitude) without any significant reasons from the chemism of investigated systems . However, the analytical characteristics like the slope of the calibration curve (the sensitivity coefficient) and the linear dynamic range are of great importance. But there was practically no study on the influence of the geometry parameters of TL spectrometer upon the magnitude and the dynamic range of the analytical signal.Data Processing
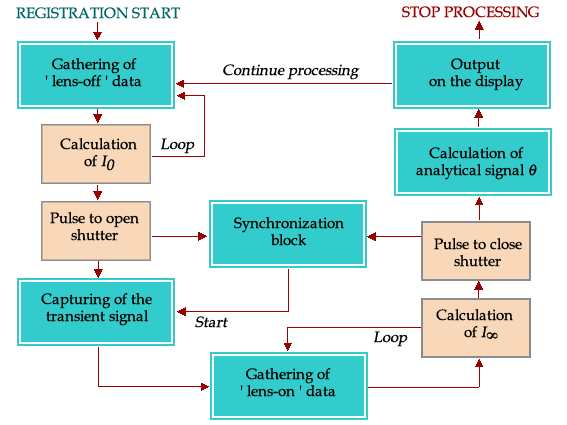
The self-made software proceeded as follows. The program served to detect and to handle the steady-state values of the TL signal. This software can also be applied when using the TL spectrometer as a chromatographic detector. The scheme of the algorithm for data capturing and the calculations is shown on the figure.
In the beginning of the process cycle the shutter of the chopper is closed and the initial ("lens-off") signal I0 is gathered under DMA control (Channel 1, 256-1024 points, approximately 1 ms per point). The data are continuously averaged and the spurious points (more than 4 standard deviations) are immediately discarded. When the change in the average value of I0 becomes less than the chosen tolerance the program sends the pulse to the synchronization block to open the shutter. During the process of the thermal lens blooming the points corresponding to the transient signal are stored in the special data array (and can be viewed if needed). When the steady state is reached (1% relative difference between two subsequent points) the program starts to calculate steady-state ("lens-on") probe beam intensity IҐ. The algorithm is quite analogous to that for I0. Usually it takes about 100-200 points. After finishing this operation the analytical signal is calculated. The pump power during the cycle (from Channel 2) is averaged and the received signal was recalculated to the initial laser power. In the end of the cycle the analytical signal, time dependence curve and several metrological values (the relative standard deviation, the corresponding confidence interval and the fluctuations of the power of the lasers (in %) are displayed. Next, the process is repeated. The collected data can be viewed, printed and stored in a file both in numerical and graphic forms


